大数据入门06-spark项目实战
在这篇文章中,我们会用pyspark分析空气质量,并且把数据存入elasticsearch,用kibana进行可视化。
数据准备
数据来源:http://stateair.net/web/historical/1/1.html
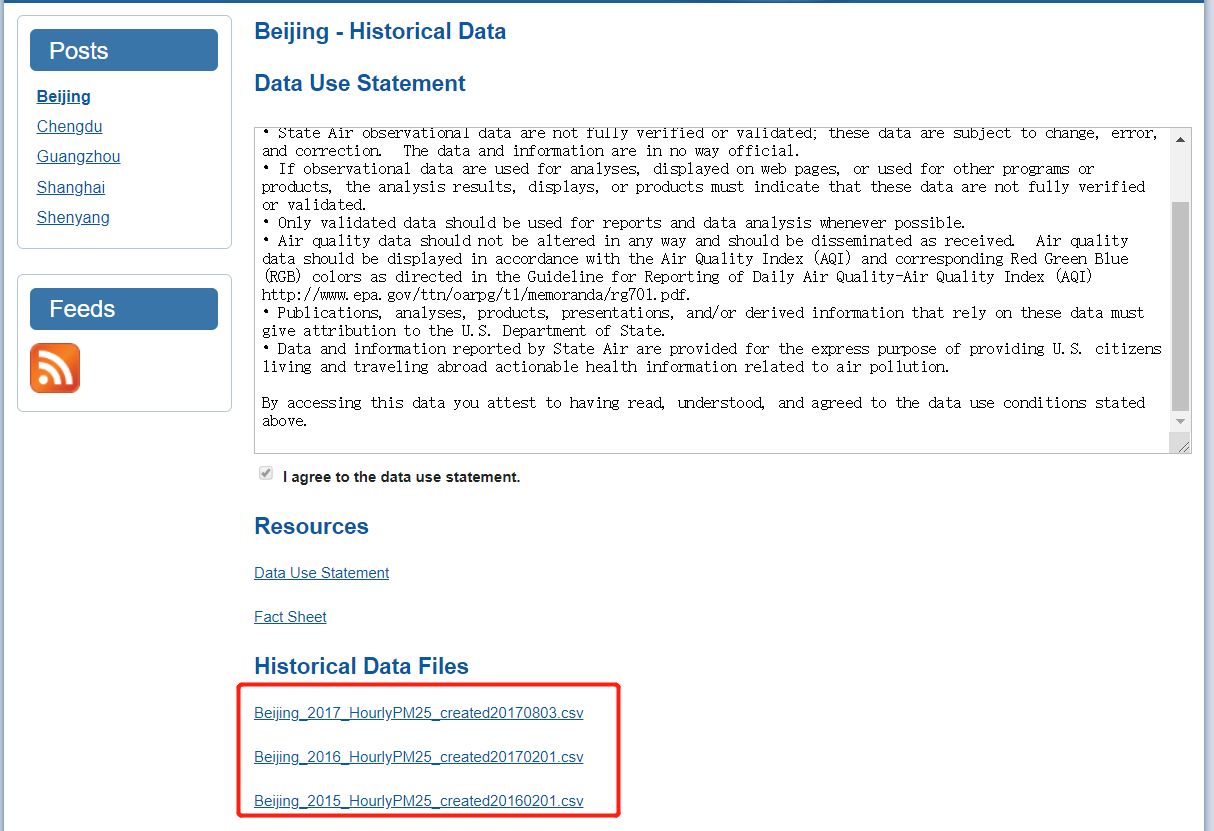
我们把数据下载到本地,然后上传到hdfs
1 | hadoop fs -put Beijing* /data |
编写pyspark程序
创建sparkSession
1 | spark = SparkSession.builder.appName("project").getOrCreate() |
加载数据
1 | data2017 = spark.read.format("csv").option("header","true").option("inferSchema","true").load("/data/Beijing_2017_HourlyPM25_created20170803.csv").select("Year","Month","Day","Hour","Value","QC Name") |
其中option(“inferSchema”,”true”)是用于自动推导数值类型的
编写自定义函数
我们需要把value的值进行聚合,并且按照空气质量指数进行划分1
2
3
4
5
6
70-50 健康
51-100 中等
101-150 对敏感人群不健康
151-200 不健康
201-300 非常不健康
301-500 危险
>500 爆表
- 自定义函数的一般流程
1
2
3
4
5
6
7
8
9
10
11
12
13
14
15# 1.创建普通的python函数
def toDate(s):
return str(s)+'-'
# 2.注册自定义函数
from pyspark.sql.functions import udf
from pyspark.sql.types import StringType
# 根据python的返回值类型定义好spark对应的数据类型
# python函数中返回的是string,对应的pyspark是StringType
toDateUDF=udf(toDate, StringType())
# 使用自定义函数
df1.withColumn('color',toDateUDF('color')).show()
1 | def get_grade(value): |
按空气质量指数进行分组聚合
1 | group2017 = data2017.withColumn("Grade", grade_function_udf(data2017['Value'])).groupBy("Grade").count() |
数据写入到elasticsearch
1 | result2017.selectExpr("Grade as grade", "count", "precent").write.format("org.elasticsearch.spark.sql").option("es.nodes","192.168.111.101:9200").mode("overwrite").save("weather2017/pm") |
完整的代码在 https://github.com/dik111/pyspark-project/blob/master/13/wea.py
Elasticsearch安装配置
下载地址:https://artifacts.elastic.co/downloads/elasticsearch/elasticsearch-6.6.0.tar.gz
安装配置
1 | tar -zxvf elasticsearch-6.6.0.tar.gz -C ../module/ |
解压完成之后需要在elasticsearch目录中,修改配置文件/config/elasticsearch.yml
添加以下内容1
2bootstrap.system_call_filter: false
network.host: 0.0.0.0
启动elasticsearch
在后台启动elasticsearch1
2cd /bin
nohup ./elasticsearch &
这里需要注意的是elasticsearch不能用root用户启动,所以要切换到非root用户启动。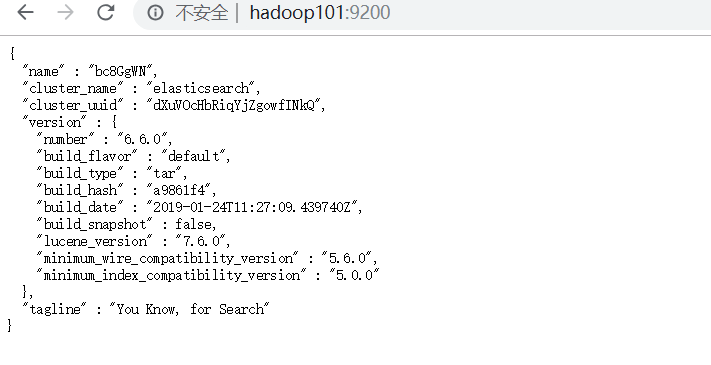
Kibana安装配置
下载地址:https://artifacts.elastic.co/downloads/kibana/kibana-6.6.0-linux-x86_64.tar.gz
安装配置
1 | tar -zxvf kibana-6.6.0-linux-x86_64.tar.gz -C ../module/ |
解压完成之后需要在kibana目录中,修改/config/kibana.yml 文件
添加以下内容:1
2server.host: "0.0.0.0"
elasticsearch.hosts: ["http://hadoop101:9200"]
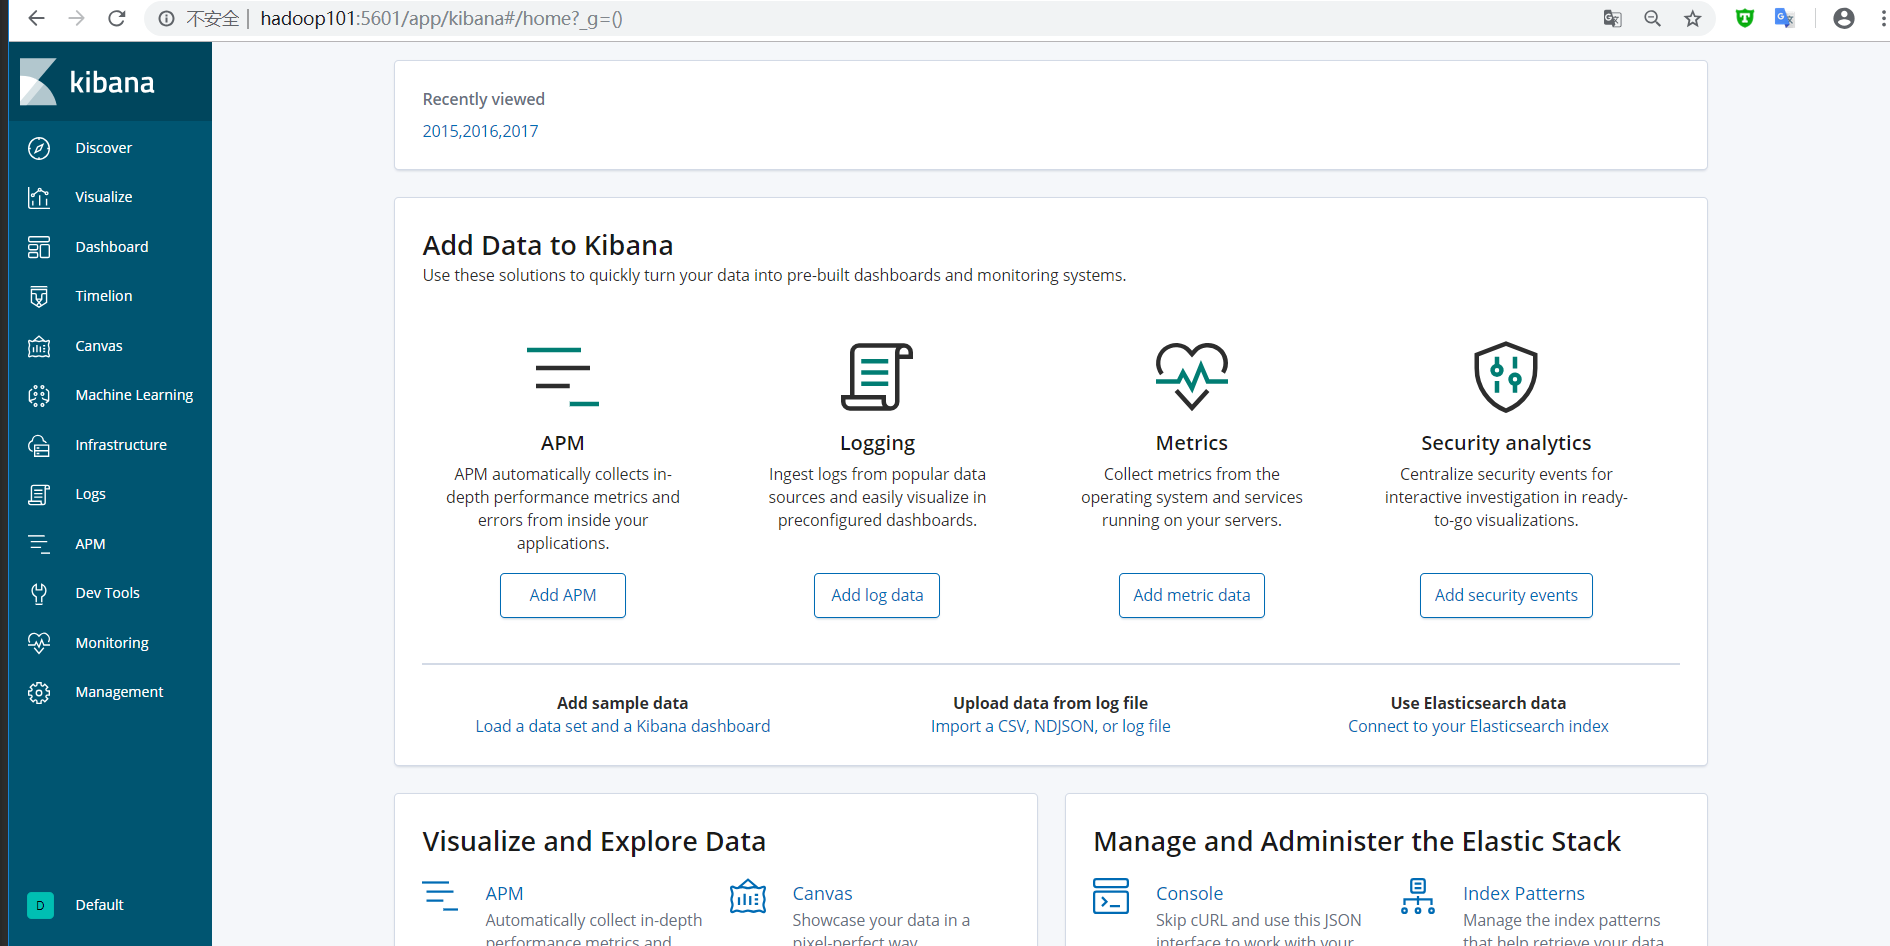
启动kibana
1 | cd bin/ |
数据写入到elasticsearch
下载elasticsearch-spark jar包
下载地址:https://www.elastic.co/downloads/hadoop
写入数据
1 | cd /opt/module/spark-2.3.2-bin-hadoop2.7/bin/ |
如果提示:ClassNotFoundException Failed to find data source: org.elasticsearch.spark.sql.,则表示spark没有发现jar包,此时需重新编译pyspark:1
2
3cd /opt/module/spark-2.3.2-bin-hadoop2.7/python
python setup.py sdist
pip install dist/*.tar.gz
Kibana可视化
打开Mangement中的Index patterns
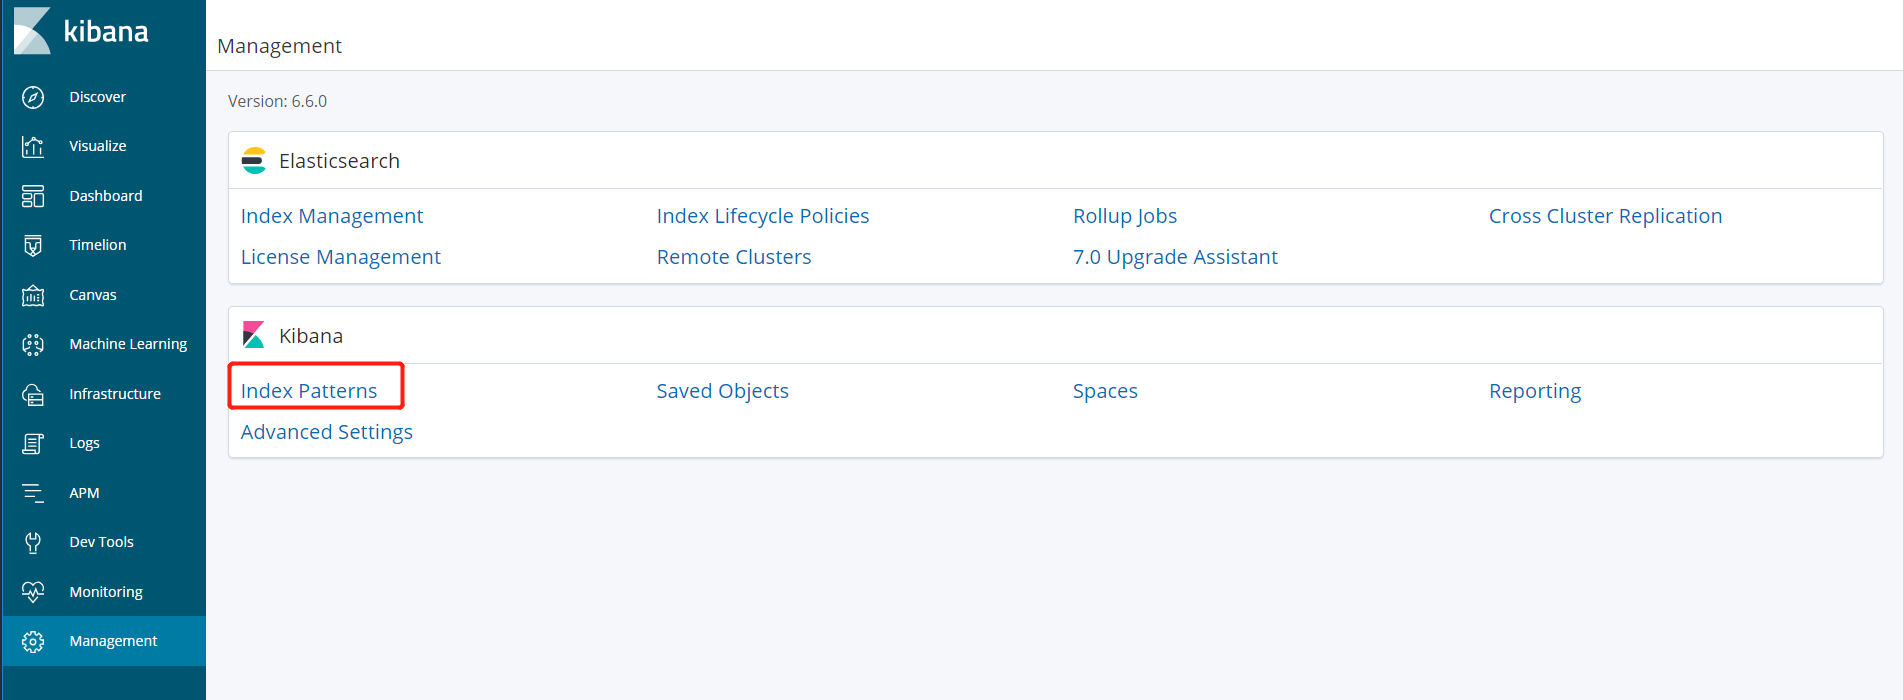
创建新的index pattern

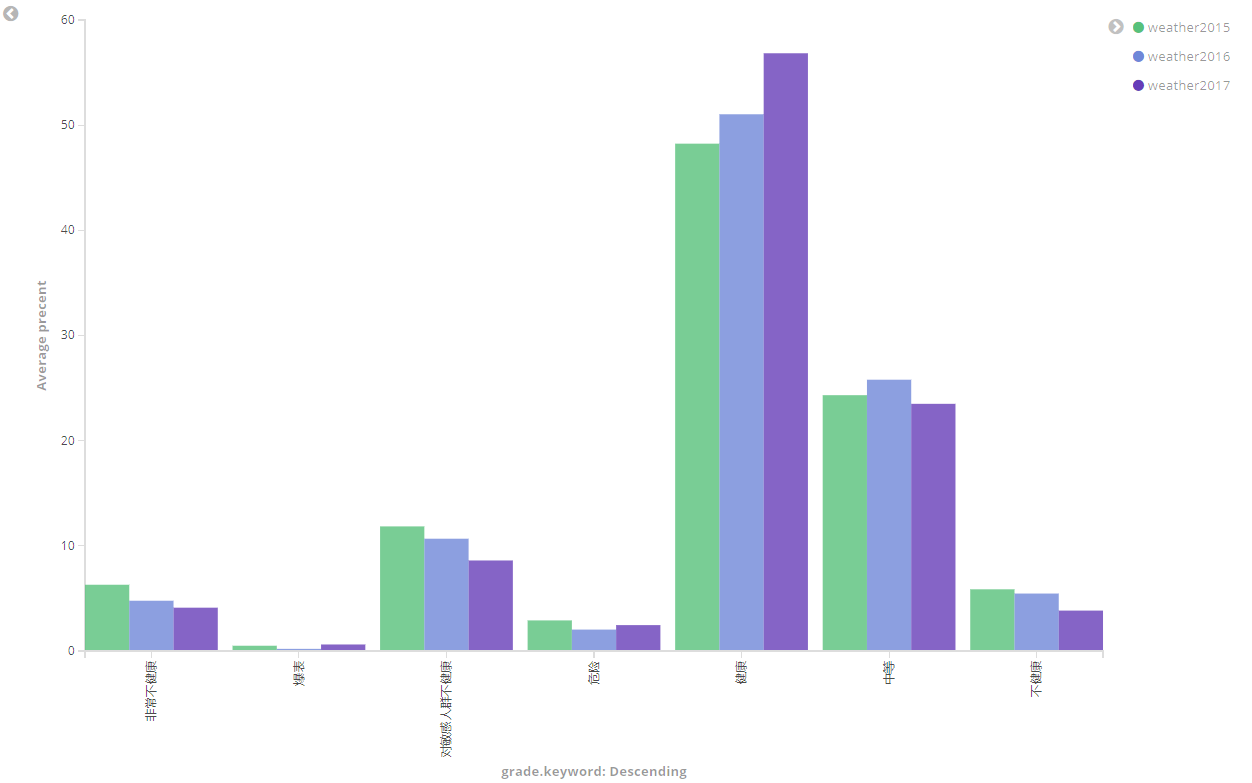
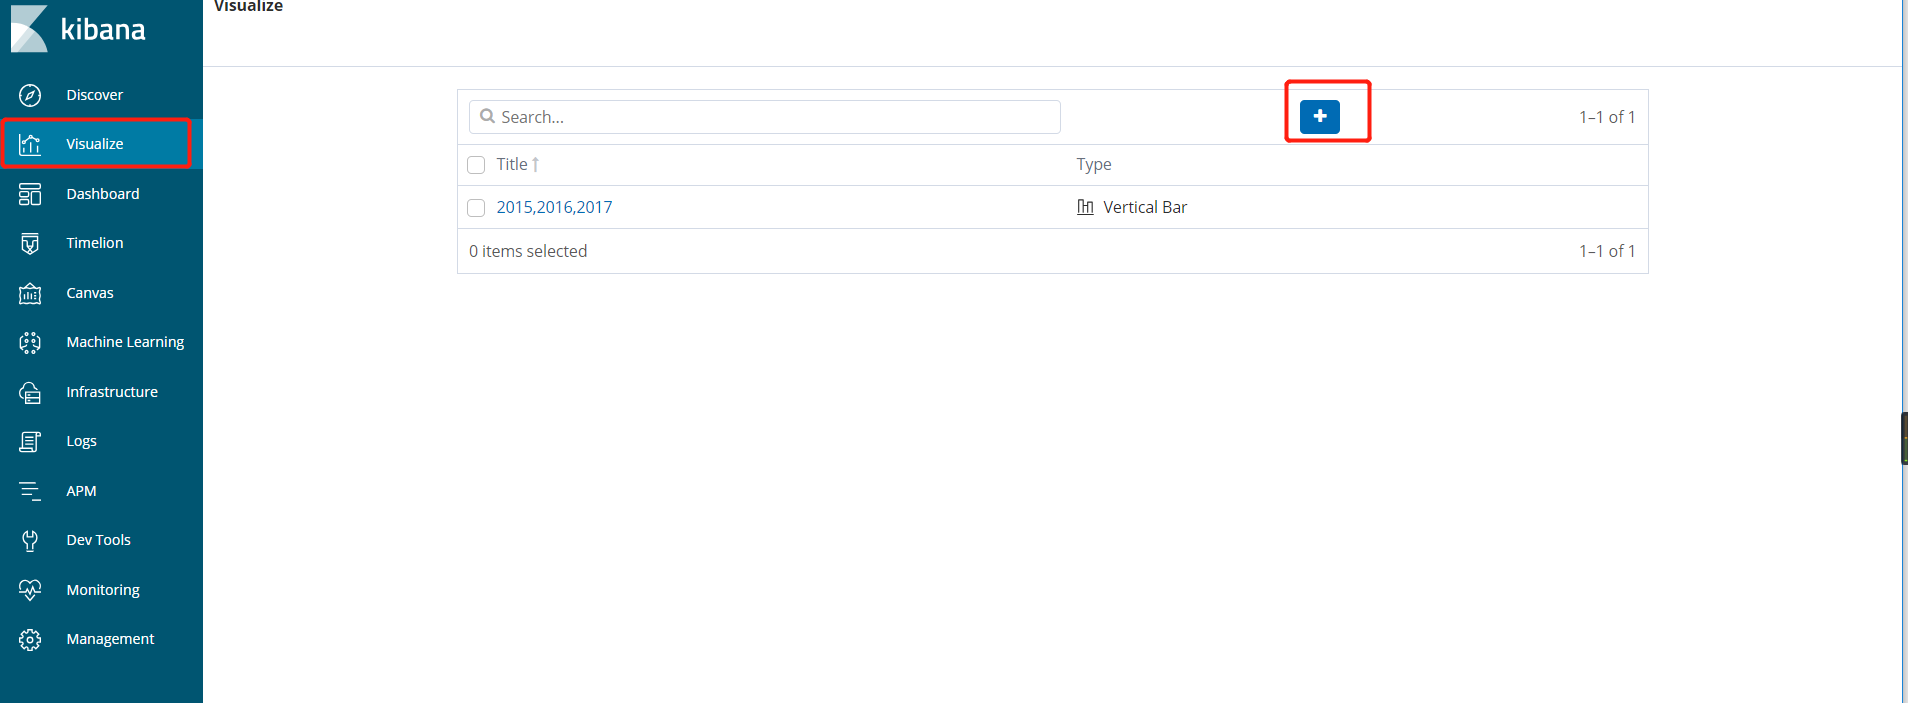
然后在visualize中创建可视化条形图
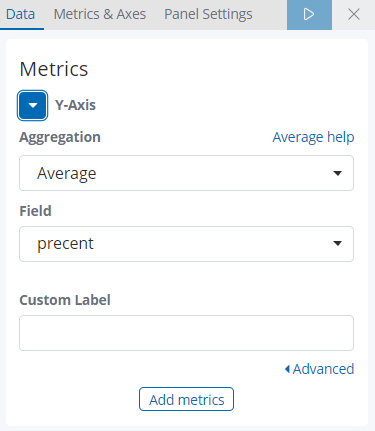
- Y轴:
- X轴:
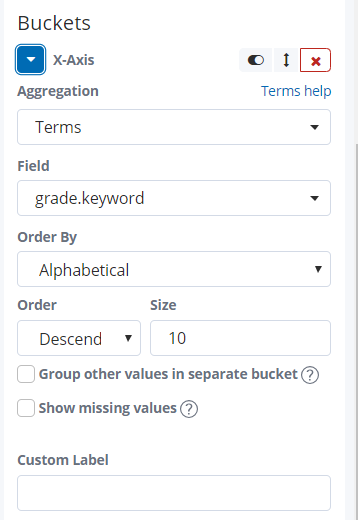
Split Series:
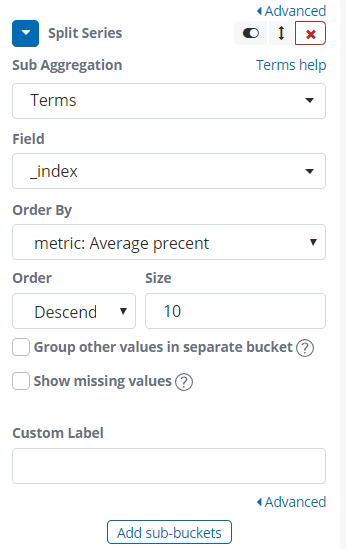
Metrics:
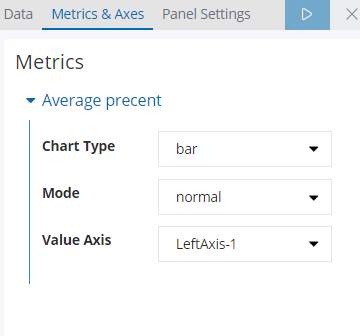
最终完成效果: